How much of an impact does content marketing really have? What’s the ROI? Why does some content go viral and not others? Who is publishing and sharing it?
As a content marketing agency, we see firsthand what works, what doesn’t, and how big of an imprint successful campaigns can have on our clients’ bottom line. Since 2013, we’ve conducted our own content marketing research – some industry-wide and some Fractl-specific.
We sifted through 26 of our past content marketing studies and pulled the most helpful, relevant stats.
Whether you’re deciding on the marketing strategy that’s right for your brand or making a case for content marketing to your higher-ups, the 104 content marketing statistics here will help inform your plan of attack.
Note: We’ll be updating this post as we do more marketing research, so check back regularly!
Table of Contents
Top Content Characteristics
Content Format Types
Content Timing
Viral Content
Social Sharing
Publisher Insight
Influencer Marketing
Content Marketing Trends
Content Marketing Campaign Performance
Content Marketing Jobs
Content Marketing vs. Other Marketing Types
BONUS: Communication
Top Content Characteristics

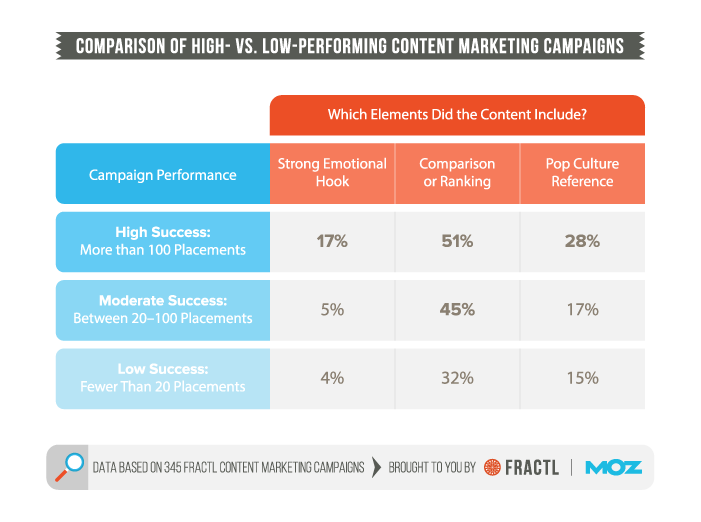
1. Based on 345 campaigns launched between 2013 and 2016, those with the highest success had more than 100 media placements. Of these campaigns, 51% had a comparison or ranking, and 28% included a pop culture reference. [What 300+ Content Marketing Campaigns Can Teach You About Earning Links]
2. Campaigns with more than 100 media placements were 3 times more likely to have a strong emotional element than less successful campaigns. Compared with campaigns that had fewer than 1,000 social shares, those with more than 20,000 shares were 8 times more likely to have a strong emotional element. [What 300+ Content Marketing Campaigns Can Teach You About Earning Links]
3. An analysis of 5,000 BuzzFeed headlines and corresponding social shares from April 2014 to April 2015 revealed 9 of the 10 highest-performing articles had a headline beginning with a number (e.g., “X Pictures …” ). 4 of the 10 lowest-performing headlines started with a number. [What You Can Learn From the Worst-Performing Headlines on BuzzFeed]
4. The 15 most-shared headlines were shared over 70% more than headlines written as a question. Including “You” or “Your” in question headlines resulted in even fewer shares, on average. [What You Can Learn From the Worst-Performing Headlines on BuzzFeed]
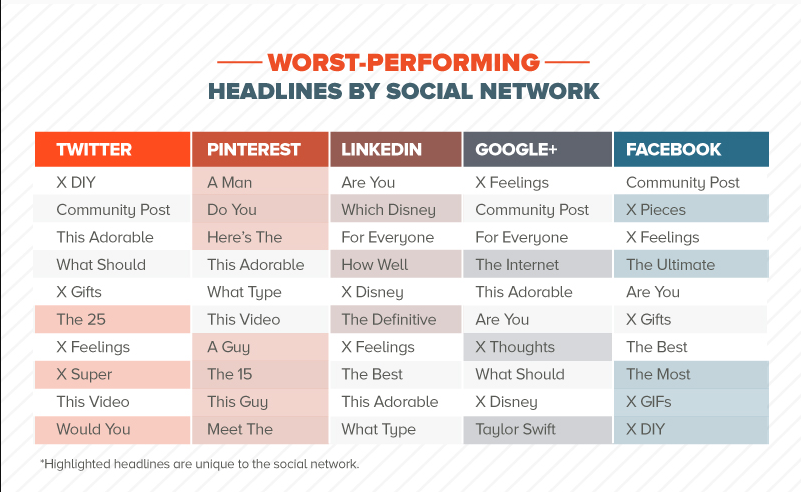
5. The 10 worst-performing headlines (aka what to avoid) were, in order from the bottom: community posts, “X Feelings,” “Are You,” “X Gifts,” “The Ultimate,” “The Best,” “X Pieces,” “What Should,” “X GIFs,” and “Would You.” [What You Can Learn From the Worst-Performing Headlines on BuzzFeed]
Generational Preferences
6. Our 2015 survey revealed the majority of each generation (Millennials, Gen Xers, and Baby Boomers) prefer the online content they read to be 300 words or less. [Content Engagement by Generation]
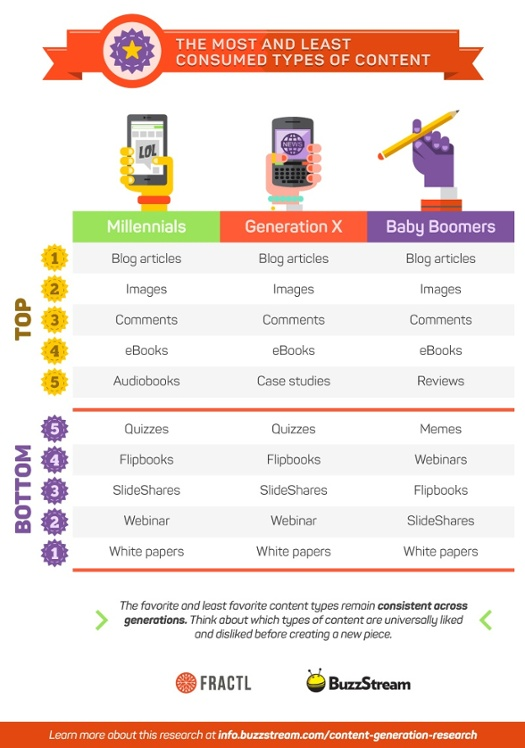
7. The top 4 types of online content preferred by each generation are blog posts, images, comments, and e-books. Audiobooks were No. 5 for Millennials, case studies for Gen Xers, and reviews for Baby Boomers. [Content Engagement by Generation]
8. When it comes to videos, over 70% of Baby Boomers and around 60% of Millennials and Gen Xers prefer the length to be 5 minutes or less. [Content Engagement by Generation]
9. More than 78% of survey respondents said the headline is one of the most important factors in deciding to read an online article. The topic and dominant image also ranked high. Less than 10% of Baby Boomers care about social engagement, compared to 18% of Gen Xers and 20% of Millennials. [Content Engagement by Generation]
10. The top 3 verticals Millennials and Gen Xers find the most engaging are Entertainment, Technology, and Food. For Baby Boomers, it’s News, Health, and Entertainment. [Content Engagement by Generation]
11. Over 60% of survey respondents prefer content that’s positive, with “amazement,” “admiration,” and “joy” being the emotions they feel the most when consuming content of their choice. Millennials and Baby Boomers also enjoy content that evokes “surprise,” while Gen Xers appreciate content that elicits “trust.” [Content Engagement by Generation]
Content Format Types

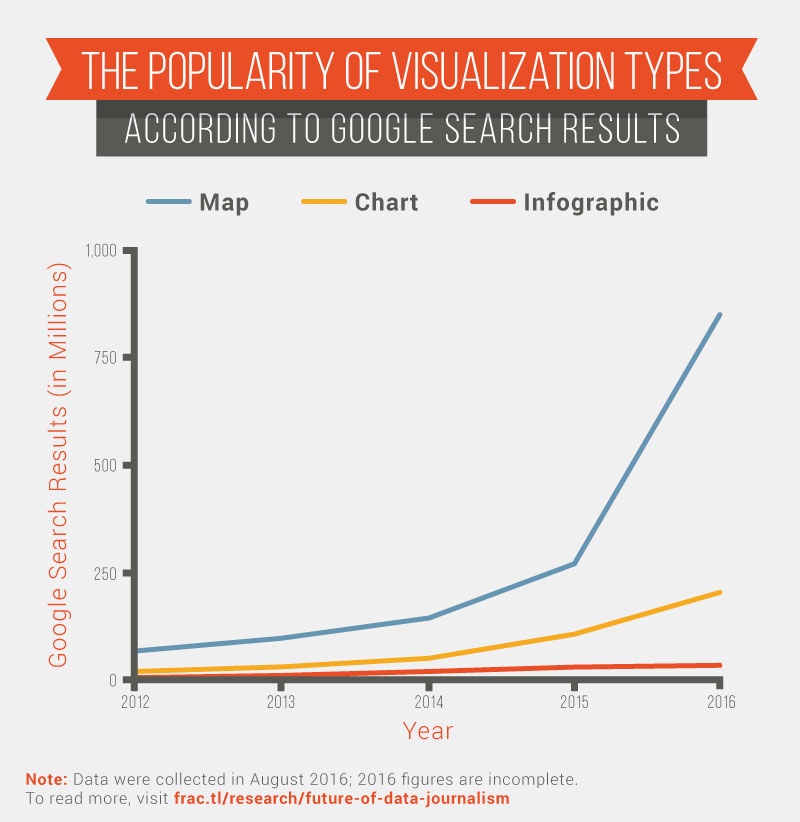
12. From 2012 to 2016, the number of Google search results for “map” grew from 68 million to 850 million. [The Popularity of Visualization Types]
13. Based on a sample of 1,300 media placements of our campaigns, publishers in the Entertainment vertical used the most visualizations – an average of 9 per campaign. The Educational vertical used the least, with fewer than 2. [What Building 26,000 Links Taught Us About Content Marketing]
14. Our survey of over 30 content marketing agencies revealed articles (35%), infographics (24%), and case studies (11%) were the top types of content that clients requested the most. Motion graphics (1%), apps (2%), and flipbooks (4%) were the least requested. [The ROI of Content Marketing vs. Native Advertising]
Content Timing

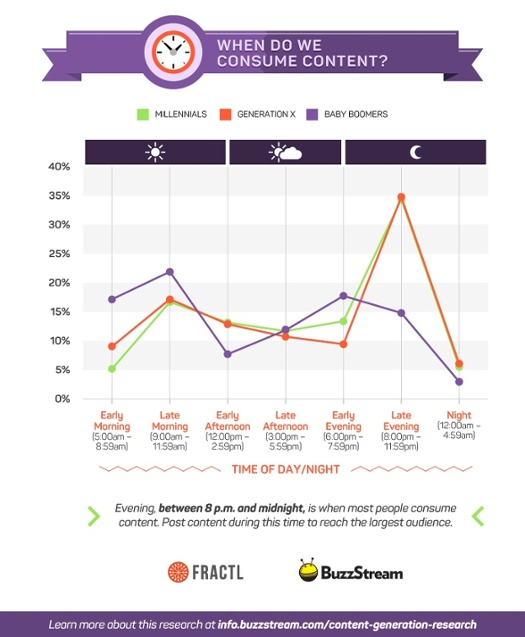
15. Over 40% of Millennials and Gen Xers consume online content after 8 p.m. Almost 40% of Baby Boomers peruse the internet between 5 a.m. and noon. [Content Engagement by Generation]
16. Baby Boomers prefer their content to be delivered during the week, while Millennials save their content for the weekend; Gen Xers are more of a mixed bag. [Content Engagement by Generation]
17. Our research on the BuzzFeed articles that earned the fewest social shares revealed articles published in June were shared the most. April was the lowest-performing month, with 33% fewer shares than June. Overall, Q1 had the fewest social shares of all quarters. [What You Can Learn From the Worst-Performing Headlines on BuzzFeed]
Viral Content
18. Looking at the 100 most-shared articles on BuzzFeed from March 2015 to March 2016, 15% were over 1,000 words. Top articles pertaining to physical health averaged 349 words, family and friends had 417, and women had 435. The topics with the highest average word counts were region-specific/travel (979 words), books/movies/TV (960), and current events (920). [What’s the Perfect Length for Viral Content?]
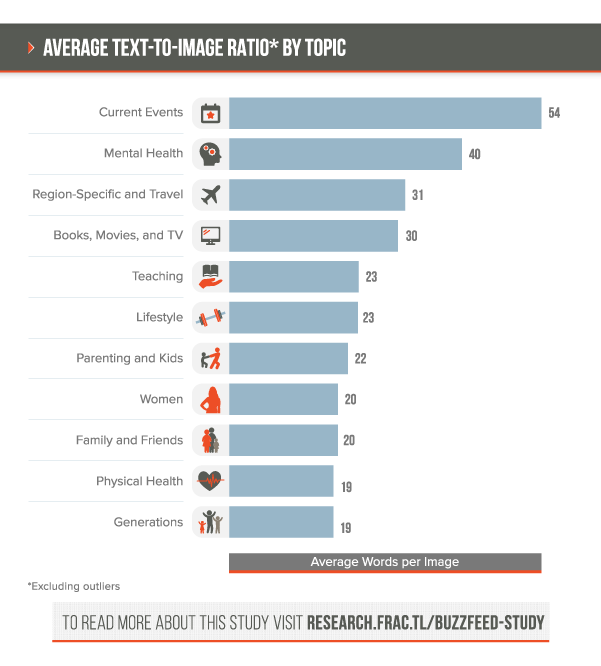
19. Topics of viral articles on BuzzFeed with the highest text-to-image ratio were current events (54 words per image), mental health (40), and region-specific/travel (31). Topics with the lowest ratio were generations (19), physical health (19), family/friends (20), and women (20). [What’s the Perfect Length for Viral Content?]
20. Our analysis of how viral content impacted a brand’s metrics revealed #TheDress dispute increased Roman Originals’ press mentions by 17,550%, U.S. organic traffic by 420%, and new inbound links by 2,339%. [Is Any Press Good Press?]
21. Following host Steve Harvey’s mix-up of the Miss Universe winner, the pageant’s press mentions increased by 199% and its organic traffic rose by 123%. [Is Any Press Good Press?]
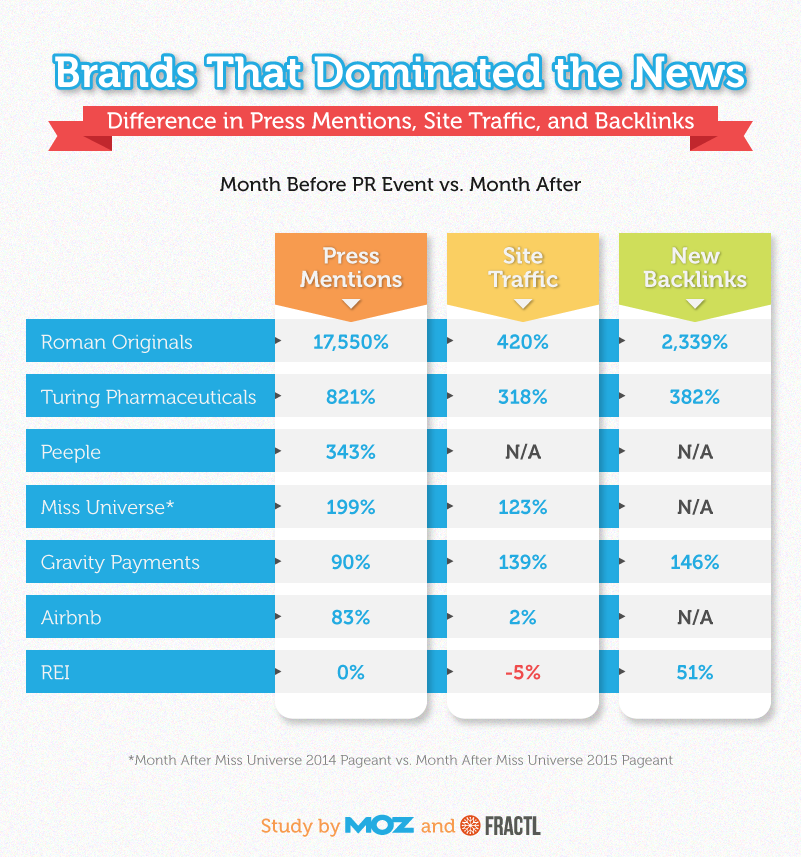
22. After negative news of Turing Pharmaceuticals hiking prescription drug prices spread, the brand saw press mentions increase by 821%, organic traffic rise by 318%, and new links jump 382%. [Is Any Press Good Press?]
Emotions & Viral Content
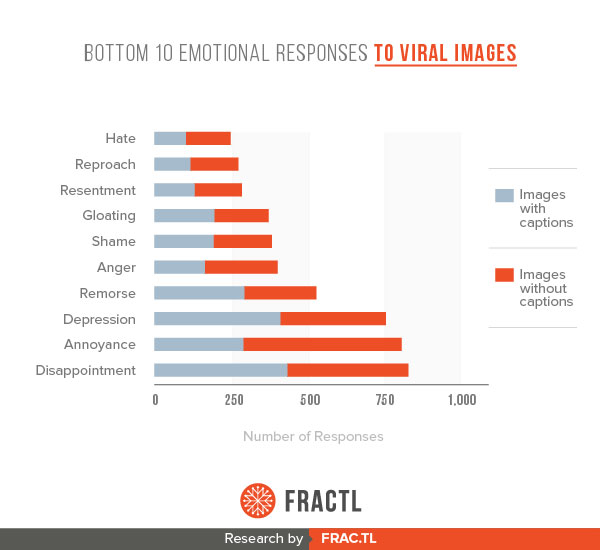
23. Of the top 100 images on Reddit’s r/pic community, the 10 most common emotions felt by 400 survey participants were positive. Happiness, surprise, and admiration held the top 3 spots. Happiness was reported in about 7,000 instances. [Why Certain Emotional Combinations Make People Share]
24. Hate, reproach, and resentment were the least-reported emotions, with hate occurring approximately 250 times. [Why Certain Emotional Combinations Make People Share]
25. Our research of the emotions involved in viral content in 2013 had impactful findings. The top 10 emotions that were most common in highly viral content were: amusement, interest, surprise, happiness, delight, pleasure, joy, hope, affection, and excitement – all positive emotions. [The Emotions That Make Marketing Campaigns Go Viral]
26. The bottom 10 emotions least common in highly viral content were: anger, politeness, frustration, doubt, embarrassment, despair, hurt, guilt, contempt, and shame – nearly all negative emotions. [The Emotions That Make Marketing Campaigns Go Viral]
27. Millennials reported fewer emotions related to surprise than the older generations. Men and women reported mostly similar reactions to viral content, with men showing more joyful feelings overall and women showing more negative emotions as well as trust emotions. [The Emotions That Make Marketing Campaigns Go Viral]
Social Sharing

28. The number of publishers averaging 5,000 or more shares per article increased from 11 in 2014 to 14 in 2016. [3 Billion Shares]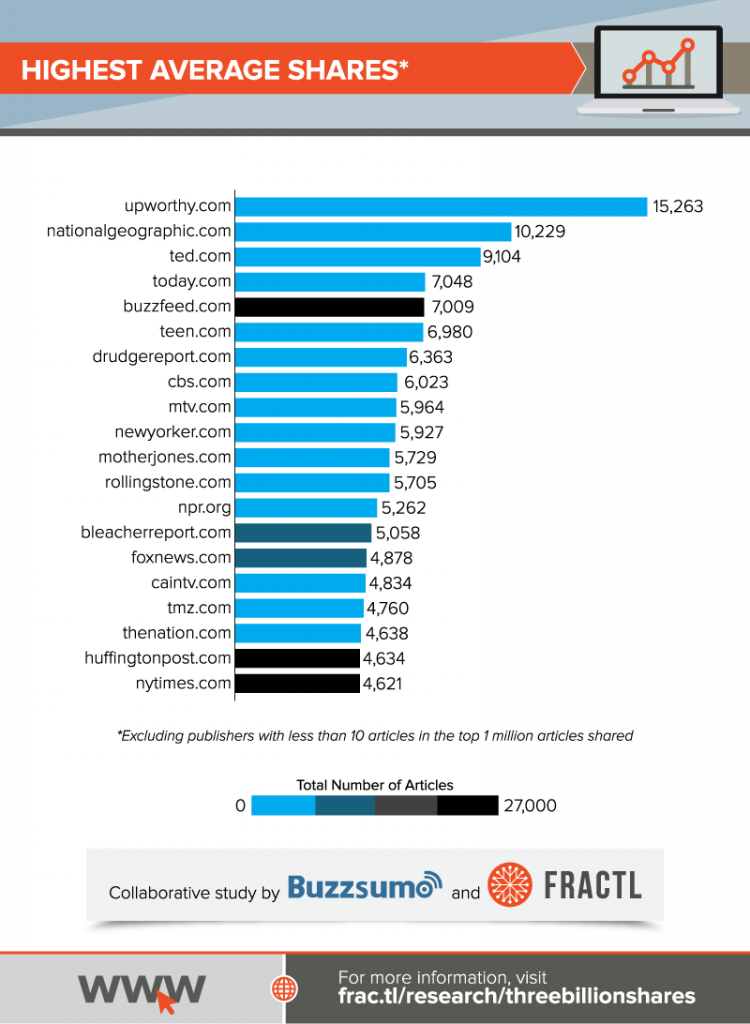
29. Of the 1,000 most-shared articles, 69.3% had a positive sentiment, 23.0% were neutral, and 7.7% were negative. [3 Billion Shares]
30. The 10 publishers with the highest average social shares were (in order): Upworthy, National Geographic, Ted.com, Today.com, BuzzFeed, Teen.com, Drudge Report, CBS, MTV, and The New Yorker. [3 Billion Shares]
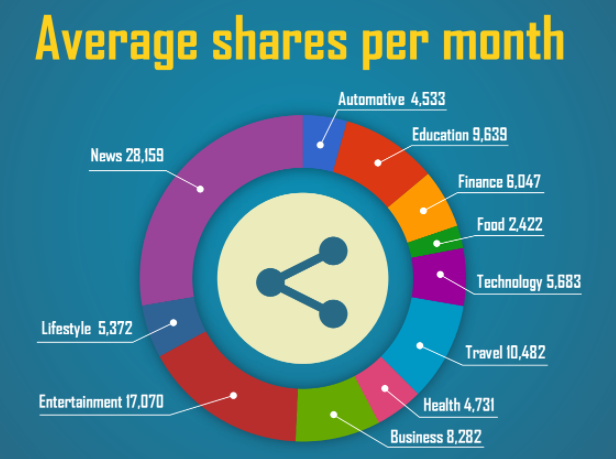
31. Our analysis of 220,000 pieces of content during a 6-month period in 2014 revealed the News vertical had the highest average number of social shares per month with 28,159 shares. Entertainment (17,070), Travel (10,482), Education (9,639), and Business (8,282) rounded out the top 5. The bottom 5 were Food (2,422), Automotive (4,533), Health (4,731), Lifestyle (5,372), and Technology (5,683). [Social Content Calendar]
32. Lists were the most-shared content type during 3 of the 6 months we looked at. “Why” posts were the most-shared for 2 of the months, and 2nd-most-shared for 3 other months. “What” posts were most-shared during 1 month. [Social Content Calendar]
Social Network Trends
33. Facebook comprised 90.2% of all social media shares of the 1 million most-shared articles from December 2015 to June 2016 – an increase from 89.2% in 2014. Twitter followed with 6.1%, and LinkedIn with 2.5%. [3 Billion Shares]
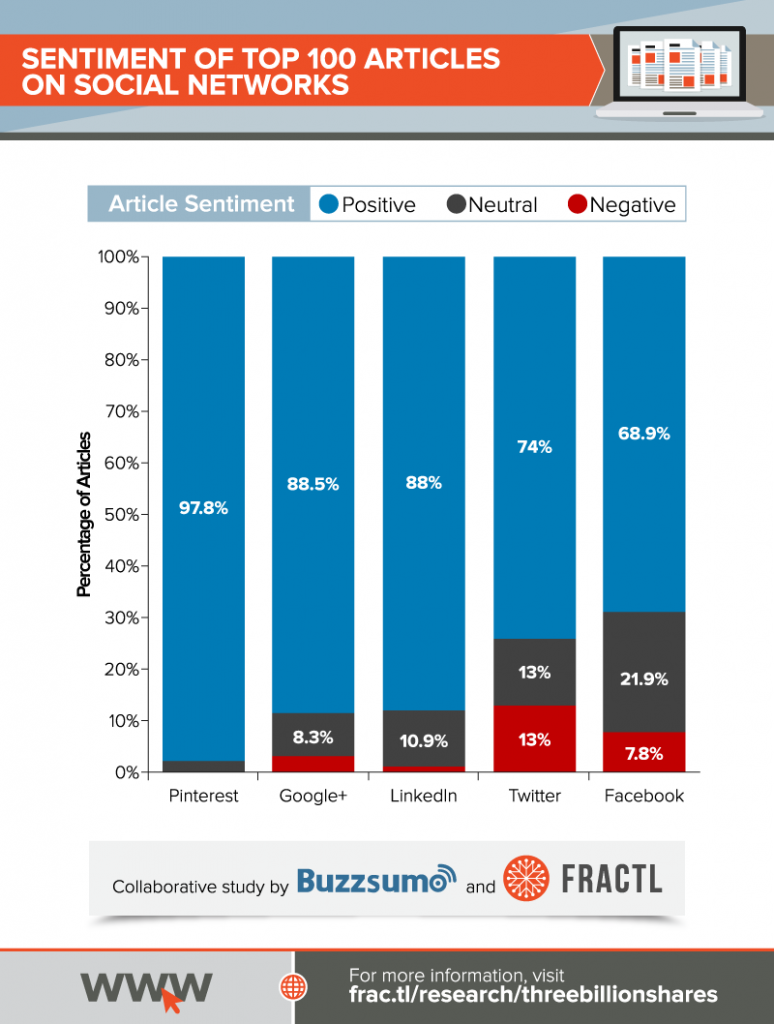
34. Looking at the 100 most-shared articles on each social platform, Twitter had the highest percentage with negative sentiment (13%). [3 Billion Shares]
35. 56% of Facebook users look at their news feed more than once a day – based on a survey of 2,000 users. 18% share content more than once a day, with women 26% more likely than men to share more than once a day. 2% share content once a month or less. [The Motivations for Sharing on Facebook] [The Sharing Habits of the Average Facebook User]
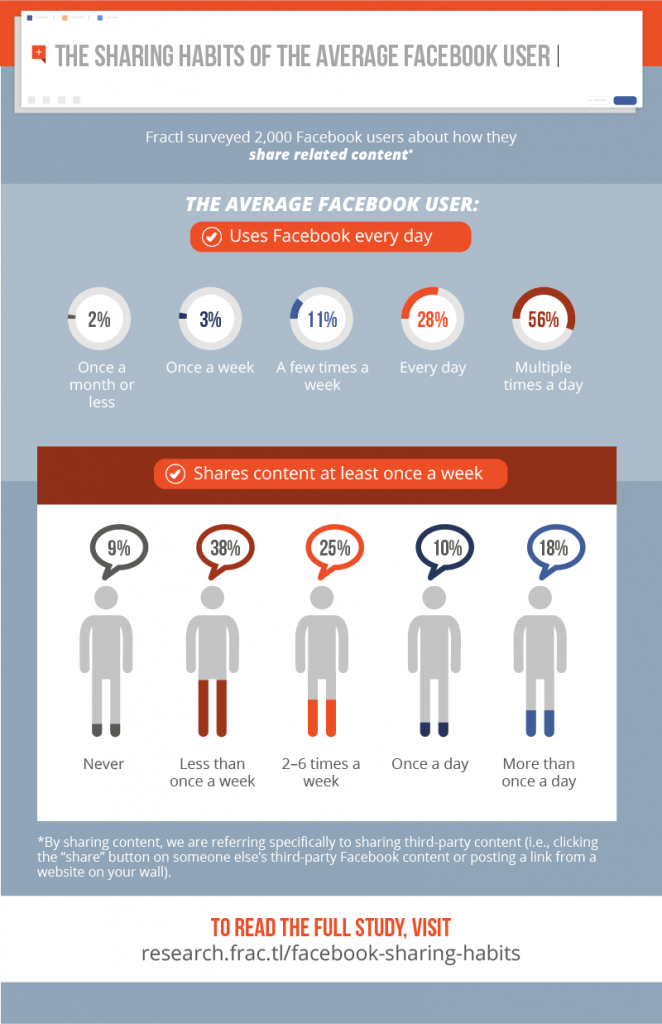
36. 8% more men than women share political content or satirical news. 2 times as many women share cute animals or baby videos. Men and women share funny videos or articles and news content equally. [The Sharing Habits of the Average Facebook User]
37. 62% of Facebook users have “taken a break” from the social media network at least once. [The Sharing Habits of the Average Facebook User]
38. After Facebook, Twitter came in 2nd for most social shares of the BuzzFeed articles we examined. However, headlines with certain phrases achieved almost 975% more shares on Pinterest than Twitter (e.g., “All the,” “X Disney,” and “X Charts”). [What You Can Learn From the Worst-Performing Headlines on BuzzFeed]
Sharing Motivations
39. 48% of survey respondents said the No. 1 reason they share news, articles, etc., on Facebook is to entertain their friends and family. This is followed by 17% who share to express the issues they care about, and 13% who share to evoke an emotional response. [The Motivations for Sharing on Facebook]
40. Of the 11% who share on Facebook to educate others, 45% are not concerned with how useful it is to others. [The Motivations for Sharing on Facebook]
41. Of those who share content on Facebook at least 5 times a day, 42% say they share to maintain a particular image of themselves. [The Motivations for Sharing on Facebook]
42. 52% of Facebook users avoid sharing controversial content, and 40% share content that makes them look good. [The Motivations for Sharing on Facebook]
43. Our survey of 1,000 people investigated 5 broad facets of identity (personal, relational, social, collective, and superficial) and how they relate to sharing content online. 84% said their relationships/friendships are important factors when deciding to share content; 63% placed importance on personal values and moral standards. [Identity and Content Sharing]
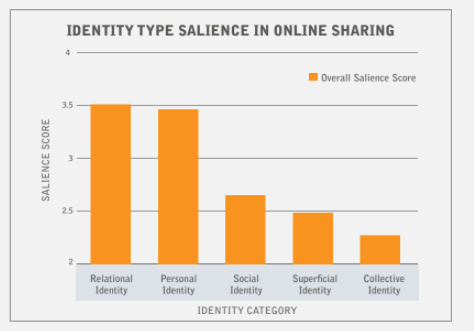
44. Collective identity – factors relating to generation, race, and religion – ranked as the lowest considerations in online sharing behavior; less than 10% said any of these factors are “extremely important.” 55% said religion, in particular, was “not important.” Ranking 2nd lowest, less than 30% said their sex or age (superficial identity factors) was important. [Identity and Content Sharing]
45. When it comes to what’s most important when sharing content online, 44% said they want to entertain, 25% said to educate, 20% said to share something that is a reflection of who they are, 10% said to show support for a cause, and 1% said to learn something about the people on their friends list. [Identity and Content Sharing]
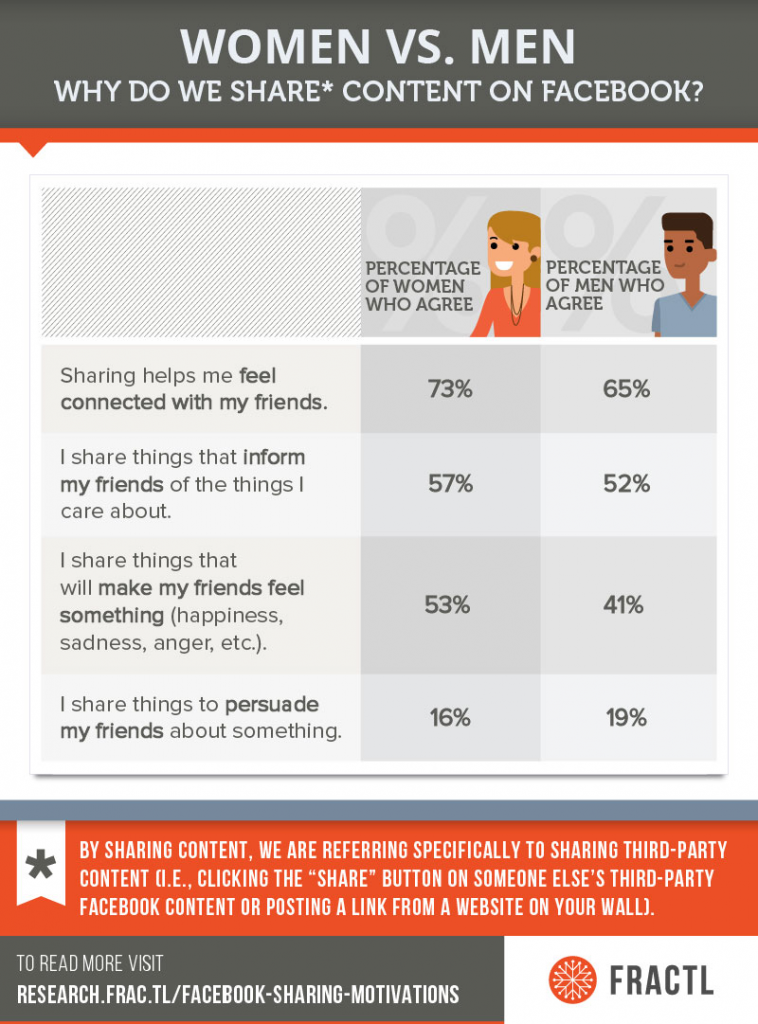
46. Women valued almost all aspects of identity slightly more than men; men placed more value on popularity with others, race, and possessions. Women ranked sharing to reflect themselves and sharing to support a cause 10% higher than men, while men ranked sharing to entertain 7% higher and sharing to educate 3% higher. [Identity and Content Sharing]
47. 71% of men and 66% of women said they posted 4 to 7 times in the past week, and 51% of men posted 1 to 3 times compared with 43% of women. [Identity and Content Sharing]
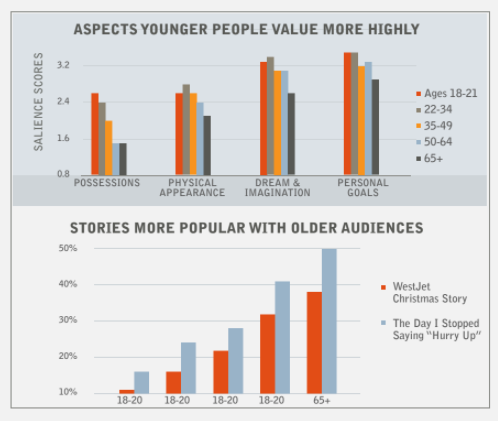
48. For those aged 65+, relationships ranked higher than any other factor. Millennials ranked possessions, physical appearance, dreams and imagination, and personal goals higher than the older generations. [Identity and Content Sharing]
Publisher Insight

49. 57% of writers and editors at top-tier publishers receive 50 to 500 pitches each week. 43% receive 5 to 50. [What 1,300 Publishers Want From Your PR Pitches]
50. Nearly 7 out of 10 writers and editors write no more than 1 story per day. [What 1,300 Publishers Want From Your PR Pitches]
51. Almost 1/2 of editors and writers have a turnaround time of 1 to 2 days. Nearly 1/4 have queue times longer than 6 days. [What 1,300 Publishers Want From Your PR Pitches]
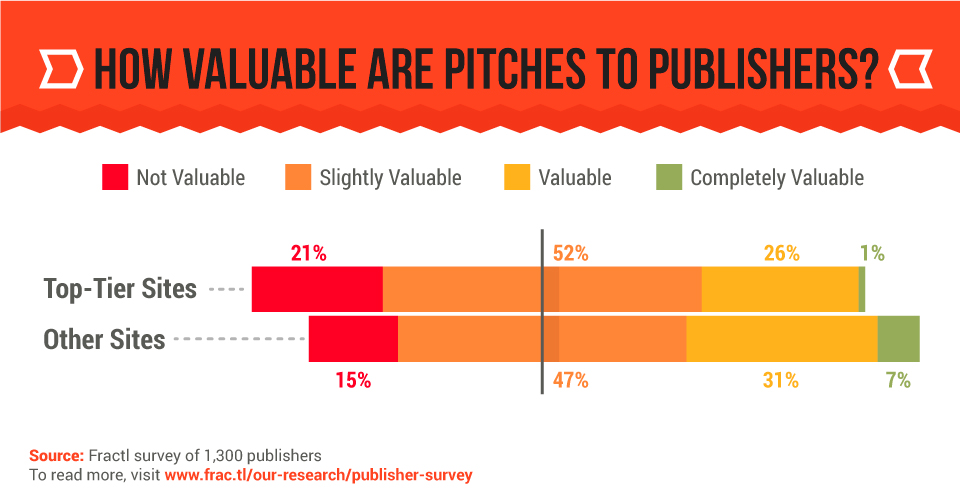
52. 79% of writers and editors at top-tier publishers and 85% of lower-tier publishers find PR pitches at least slightly valuable. [What 1,300 Publishers Want From Your PR Pitches]
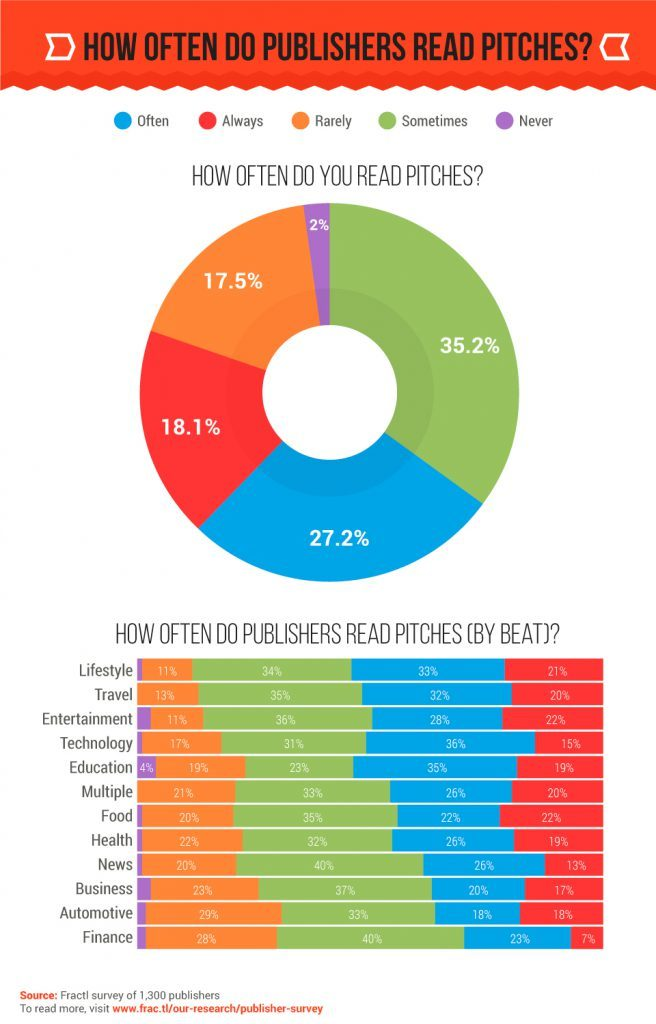
53. 45% of writers and editors often or always read pitches. 35% sometimes do, and 20% rarely or never do. [What 1,300 Publishers Want From Your PR Pitches]
54. 80% of writers and editors turn down a pitch because it’s irrelevant to their beat. 56% turn down overly promotional pitches, and 48% decline boring pitches. [What 1,300 Publishers Want From Your PR Pitches]
55. 66% of writers and editors said an email’s subject line is the No. 1 reason for opening or trashing an email. [What 1,300 Publishers Want From Your PR Pitches]
56. Over 1/2 of writers and editors prefer email pitches from 100 to 200 words. [What 1,300 Publishers Want From Your PR Pitches]
57. 88% of writers and editors write stories from pitches a few times a month or less. [The Tell-All Guide to Digital PR]
58. 41% of writers and editors prefer to receive pitches overnight or in the morning. [The Tell-All Guide to Digital PR]
59. 42% of writers and editors would flag a pitch as spam if they spotted a spelling error. [The Tell-All Guide to Digital PR]
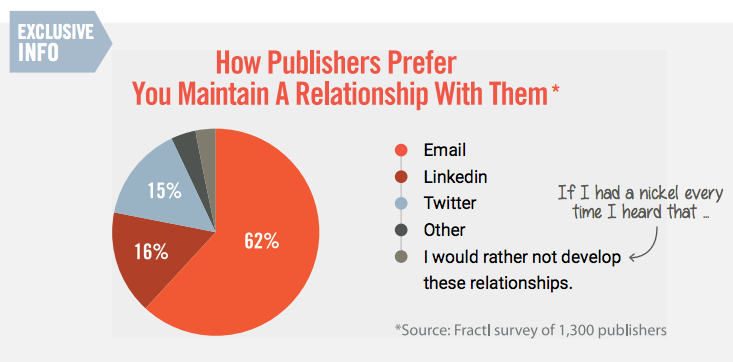
60. 62% of writers and editors prefer email as the communication method for maintaining a relationship with them. 16% prefer LinkedIn, and 15% prefer Twitter. [The Tell-All Guide to Digital PR]
Sentiment
61. Viral publishers: 100% of the 100 most-shared articles on Upworthy from December 2015 to June 2016 had a positive sentiment. 87.9% of BuzzFeed’s were positive, and 80.2% of ViralNova’s. [3 Billion Shares]
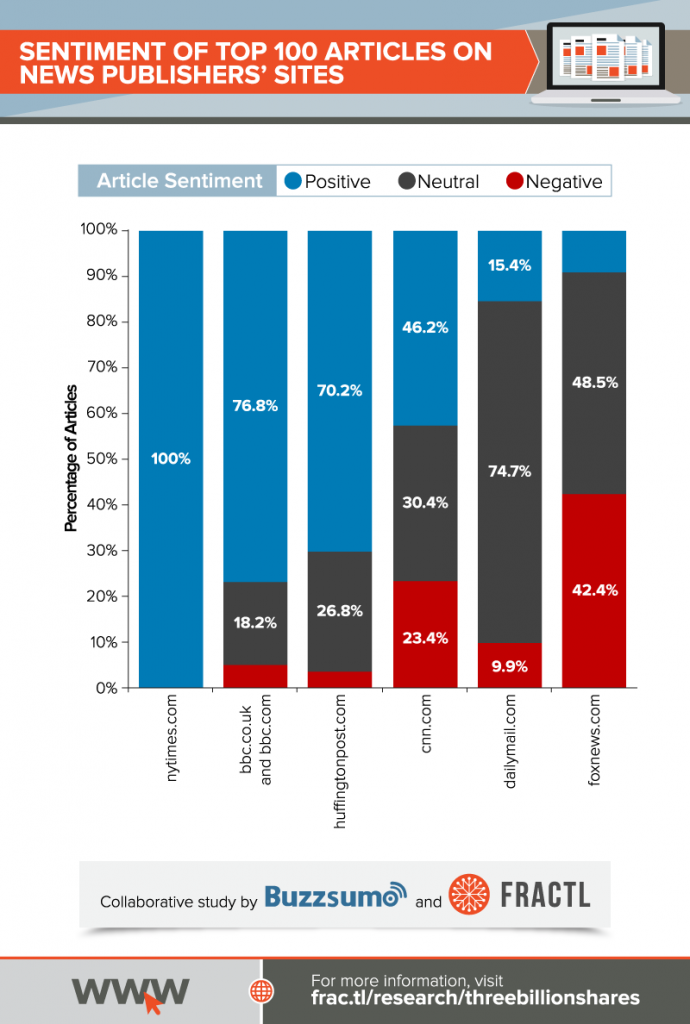
62. News publishers: 100% of the 100 most-shared articles on The New York Times were positive. BBC had 76.8%, Huffington Post 70.2%, CNN 46.2%, Daily Mail 15.4%, and Fox News 9.1%. [3 Billion Shares]
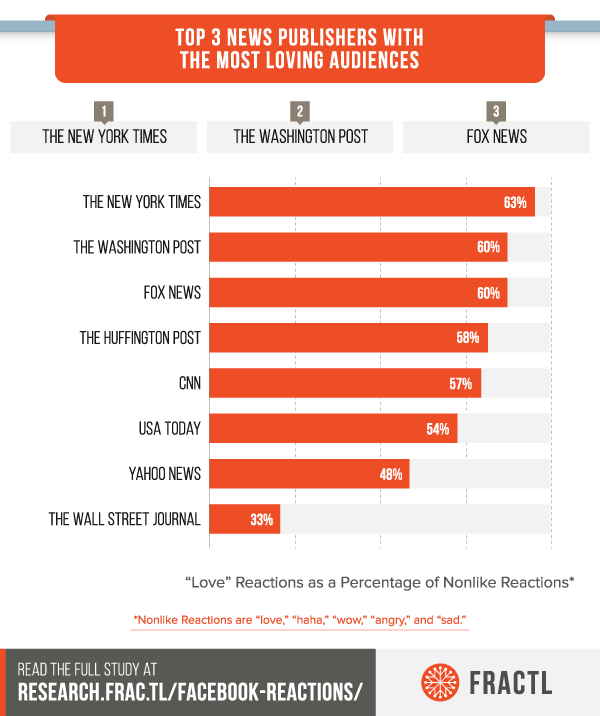
63. Looking at the top 3 Facebook posts for 8 top-tier publishers during the week of March 14, 2016, 54% of non-like Reactions were the “love” icons. 18% were “wow,” 12% were “haha,” 10% were “angry,” and 6% were “sad.” [How Are News Publishers’ Audiences Reacting on Facebook]
64. The publishers with the highest percentage of “love” reactions on Facebook were The New York Times (63%), The Washington Post (60%), and Fox News (60%). The Wall Street Journal had the lowest percentage with 33%. [How Are News Publishers’ Audiences Reacting on Facebook]
65. The publishers with the highest percentage of “angry” reactions on Facebook were Fox News (21%), The Wall Street Journal (15%), and The New York Times (9%). USA Today had the lowest percentage with 5%. [How Are News Publishers’ Audiences Reacting on Facebook]
Influencer Marketing

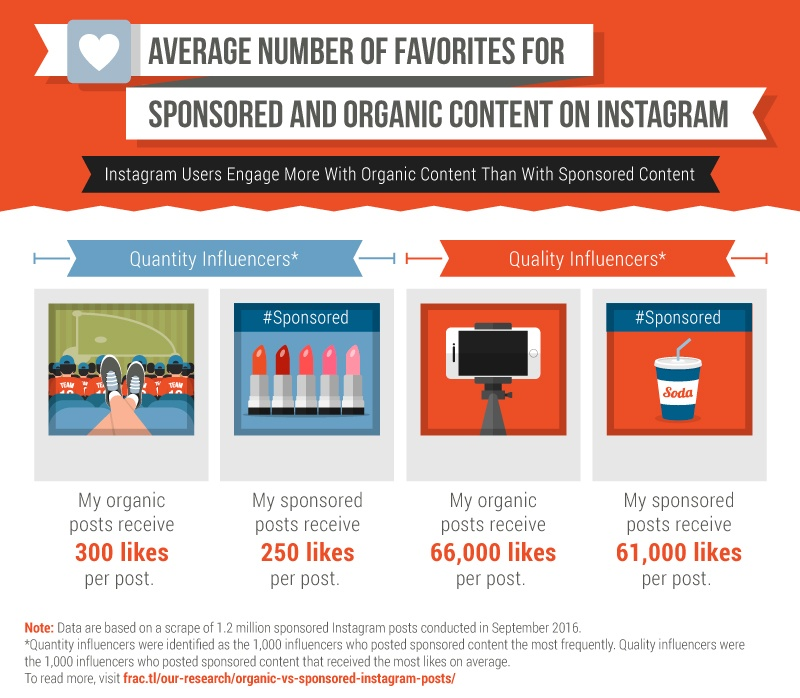
66. Quality influencers on Instagram (those with the most likes for their sponsored posts) receive more likes on sponsored posts than quantity influencers (those who post sponsored content the most). [How Effective Is #Sponsored Content on Instagram?]
- For quality influencers, sponsored posts received 9% less likes.
- For quantity influencers, sponsored posts received 17% less likes.
67. On Instagram, influencers with fewer than 1,000 followers had an 8% like rate on their posts. Those with 1 to 10 million followers had a 1.7% like rate. [How Effective Is #Sponsored Content on Instagram?]
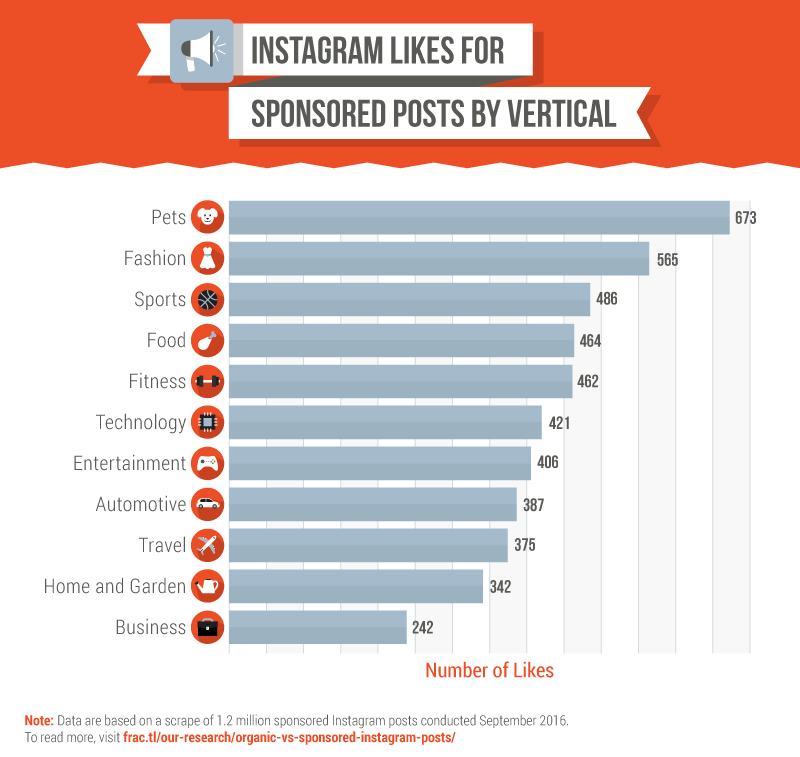
68. Sponsored Instagram posts about pets had the highest average number of likes (673); then fashion (565), sports (486), and food (464). [How Effective Is #Sponsored Content on Instagram?]
Content Marketing Trends

69. Based on our survey of over 30 content marketing agencies, 25% of agencies create an average of 5 to 9 campaigns per client each month. 19% do 10 to 19 campaigns, and 15% do 20 or more campaigns. [The ROI of Content Marketing vs. Native Advertising]
70. A look at the pricing structure of content marketing agencies showed 70% offer monthly retainers, with the rest charging per project (15%), per hour (8%), and per word (7%). [The ROI of Content Marketing vs. Native Advertising]
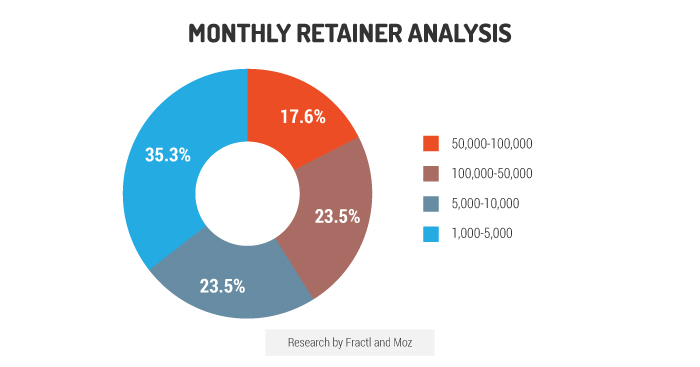
71. Of the agencies offering retainers, 35.3% charge $1,000 to $5,000 per month, 23.5% charge $5,000 to $10,000, 23.5% charge $10,000 to $50,000, and 17.6% charge $50,000 to $100,000. [The ROI of Content Marketing vs. Native Advertising]
72. The top 3 metrics clients use to measure a content marketing campaign’s success are the number of leads (20%), high-quality links (14%), and total social shares (14%). The bottom 3 metrics are referral traffic (6%), keyword rankings (7%), and the total number of links (7%). [The ROI of Content Marketing vs. Native Advertising]
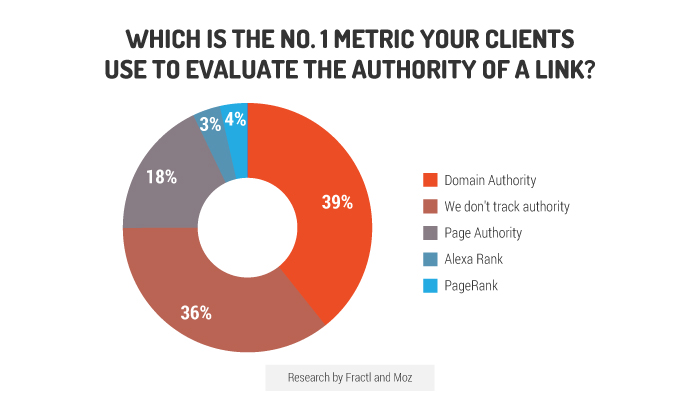
73. The top metric clients use to determine the authority of a link is domain authority (39%), while 36% don’t track authority at all. 18% look at page authority, 4% PageRank, and 3% Alexa rank. [The ROI of Content Marketing vs. Native Advertising]
Ideation
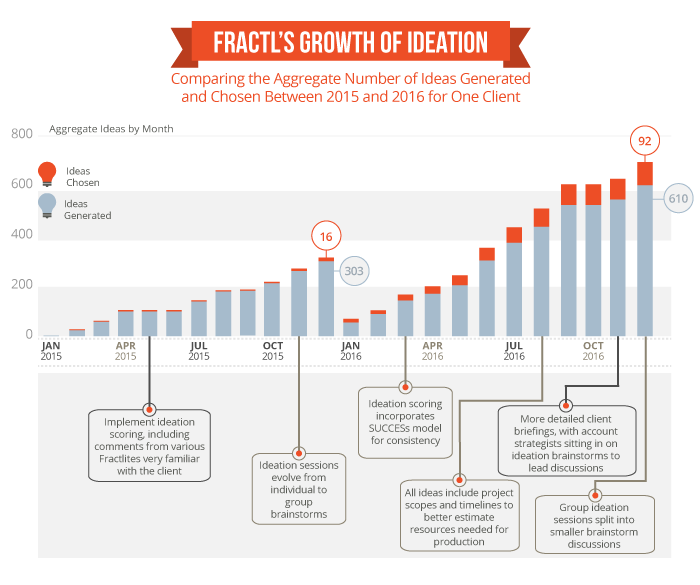 74. For one client: In Nov. 2013, we generated 303 ideas and 16 (5.3%) were chosen. In Dec. 2016, we generated 610 ideas and 92 (15.1%) were chosen. [Inside Fractl’s Ideation Process]
Content Marketing Campaign Performance

75. For one client: In 2015, our campaigns received 57 median links and 1,299 median domain authority. In 2016, the median links grew to 109 and domain authority to 2,010. That’s an increase of 91% and 55%, respectively. [Inside Fractl’s Ideation Process]
76. Of 345 campaigns created between 2013 and 2016, the average number of media placements and social shares received was 90 and 11,832, respectively. [Benchmarks for Content Marketing Success]
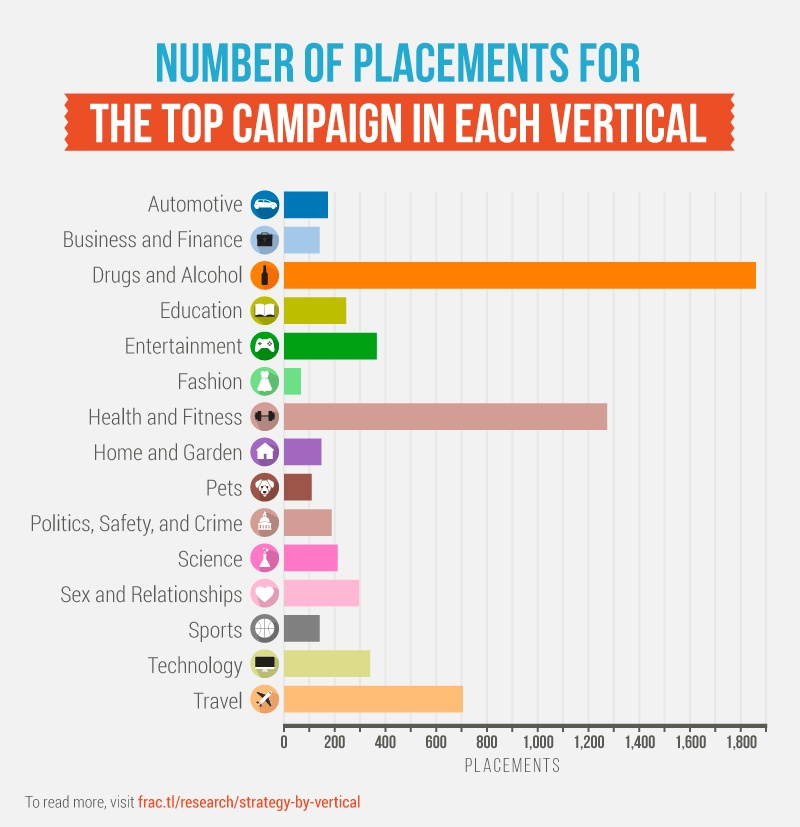
77. Campaigns in the Health and Fitness vertical received the highest average number of media placements (195) and social shares (62,621); followed by Drugs and Alcohol (149 and 14,757) and Travel (107 and 10,422). [Benchmarks for Content Marketing Success]
78. 54.2% of links from publishers with a domain authority over 59 received zero shares on social platforms. [What Building 26,000 Links Taught Us About Content Marketing]
79. On average, the top-performing link for one of our campaigns comprises 62.7% of all social shares. [What Building 26,000 Links Taught Us About Content Marketing]
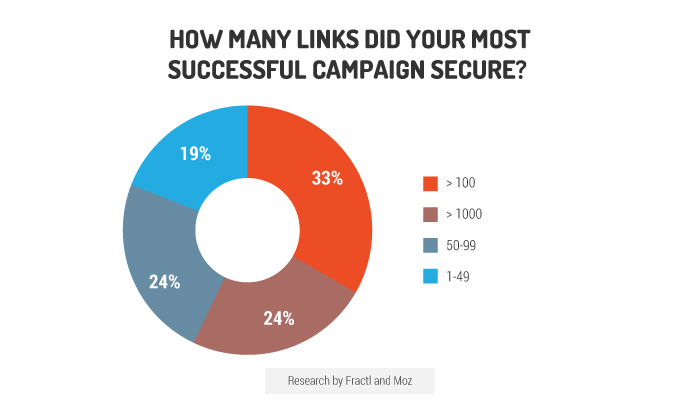
80. Based on our survey of 30+ content marketing agencies, each agency’s most successful campaign earned an average of 422 links. Specifically, 33% of agencies reported their top campaign drawing over 100 links. 24% said over 1,000 links, 24% said 50 to 99, and 19% said 1 to 49. [The ROI of Content Marketing vs. Native Advertising]
81. Across all agencies surveyed, clients who spent $1,000 to $5,000 saw their most successful campaign earn fewer than 100 links, on average. The top campaigns for those who spent $5,000 to $10,000 earned almost 400 links, and budgets of $10,000 to $50,000 resulted in the top campaign garnering nearly 700 links. [The ROI of Content Marketing vs. Native Advertising]
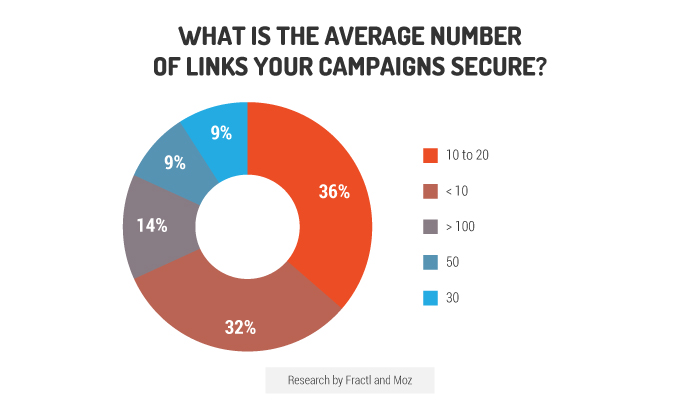
82. On average, content marketing campaigns earned 27 links (excluding outliers). Specifically, 36% of agencies said the average number of links their campaigns earned was 10 to 20. 32% said fewer than 10 links, 14% said more than 100, 9% said 50, and 9% said 30. [The ROI of Content Marketing vs. Native Advertising]
Content Marketing Jobs

83. Based on 3,300 job listings in May 2016, marketing positions with “digital marketing” in the title had an average annual salary of $80,000. “Content marketing” followed with $74,000, “social media marketing” with $51,000, and “inbound marketing” with $38,000. [Today’s Content Marketer]
84. The preferred level of education for content marketing positions: 33% of senior-level positions and 18% of junior-level positions had a master’s or MBA listed. [Today’s Content Marketer]
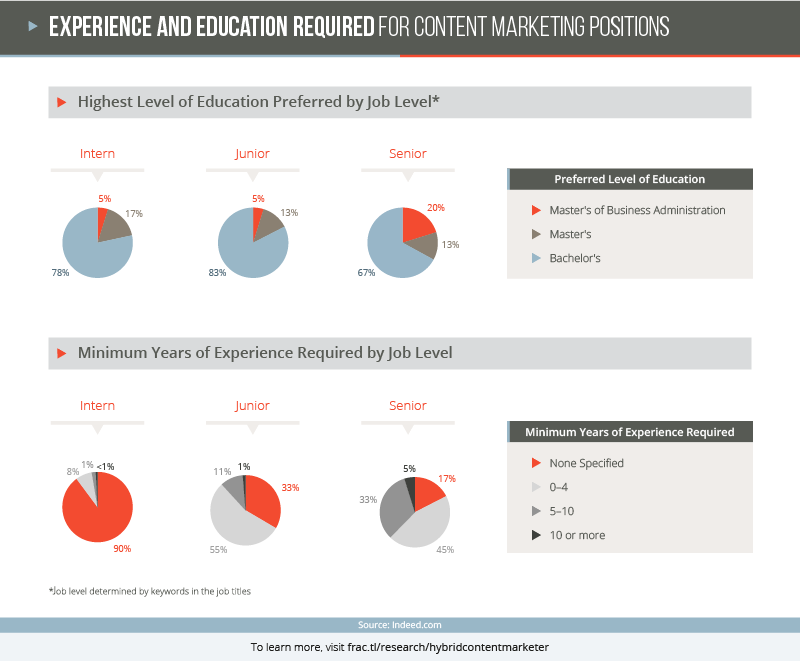
85. The minimum years of experience required for content marketing positions: 45% of senior-level positions and 55% of junior-level positions had zero to 4 years listed, with the remaining percentage requiring more years or not specifying. [Today’s Content Marketer]
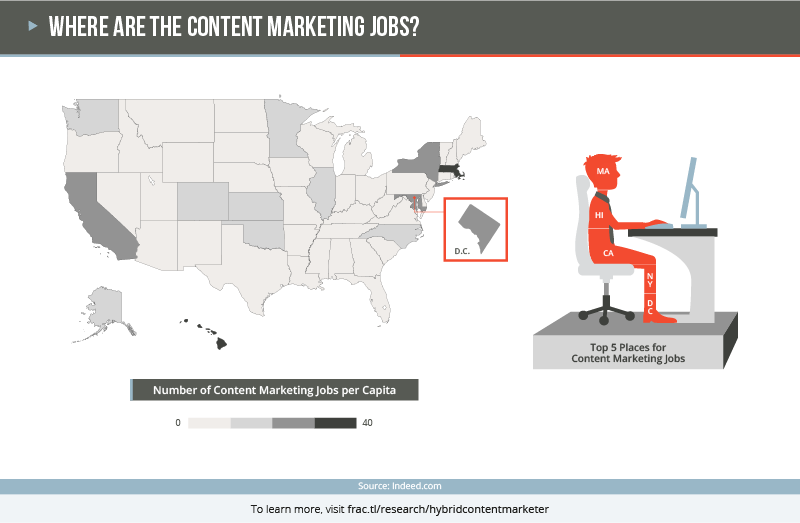
86. Massachusetts had the most content marketing jobs per 1,000 people with 37. Hawaii, California, New York, and Washington, D.C., followed. [Today’s Content Marketer]
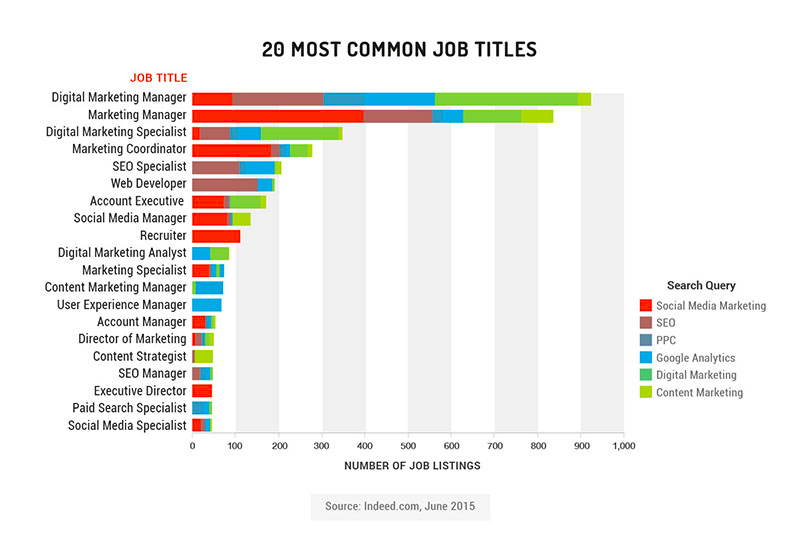
87. Our analysis of over 75,000 jobs listings in 2015 revealed that 5 of the 20 most common job titles in digital marketing required all 6 of the marketing specializations queried (social media marketing, SEO, PPC, Google Analytics, digital marketing, and content marketing). 8 other positions required at least 4 of these specializations. [The Inbound Marketing Economy]
88. Looking at millions of LinkedIn profiles, our research found professionals listing “content marketing” on their resumes grew by 165% over 2 years. “Social media” was listed in the most profiles (2.2 million) but had the 2nd-highest growth. “Inbound marketing” had the 3rd-highest growth but still appeared less frequently than “SEO.” [The Inbound Marketing Economy]
89. Based on June 2015 data, positions with the keyword “SEO” earned a national average of $102,000. “Google Analytics” and “content marketing” followed with $82,000 and $74,000, respectively. “Social media marketing” was at the bottom of our list with $51,000. [The Inbound Marketing Economy]
Content Marketing vs. Other Marketing Types

90. A $10,000 marketing spend, according to 2015 estimates, would reach 715,000 magazine readers, 300,000 viewers of a local TV ad, and 17,000 direct mail households. One of our top-performing content marketing campaigns was viewed over 3.5 million times on a single publisher. [How Content Marketing Works for Your Bottom Line]
91. In May 2015, we estimated a single native advertising campaign for top-tier publishers was $54,014.29, on average. The highest cost for a campaign was $200,000. [The ROI of Content Marketing vs. Native Advertising]
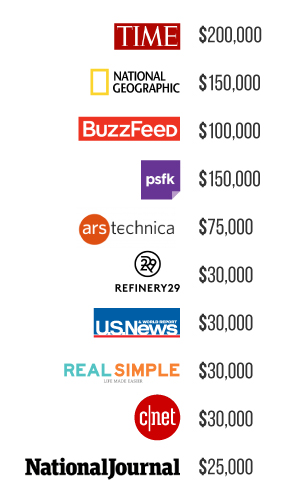
92. The average cost for a native advertising campaign for a site with a domain authority of 80+ was $35,482.50. For sites with a domain authority less than 80, the lowest cost was $10 and the highest $20,000. [The ROI of Content Marketing vs. Native Advertising]
93. At the time of our study, BuzzFeed’s most successful native advertising campaign earned 1 link and 109,020 social shares. Fractl’s most successful infographic earned nearly 1,200 links and over 324,000 social shares. [The ROI of Content Marketing vs. Native Advertising]
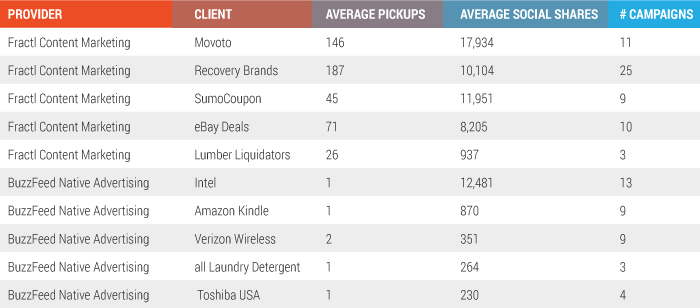
94. The average number of social shares across 38 of BuzzFeed’s native advertising campaigns was 374, with 1 link. The average number of social shares earned by 140 of Fractl’s content marketing campaigns was 10,000, with 90 links. [The ROI of Content Marketing vs. Native Advertising]
95. When we looked at marketing trends in December 2014, we found certain marketing terms increased and others decreased between January 2008 and November 2014. Those that rose (with approximate percentage increases): native advertising (60%), infographics (45%), inbound marketing (25%), social media marketing (20%), and content marketing (7%). Those that declined (with approximate percentage decreases): search engine marketing (-7.5%), pay per clicks (-7%), search engine optimization (-7%), public relations (-5%), and interactive maps (-4.5%). [Marketing Trend Report]
Inbound vs. Outbound
96. Based on a 2015 survey of 1,000 people, over 50% use an ad-blocking software. [The Efficacy of Inbound vs. Outbound]
97. To learn more about a brand, almost 90% of people use a search engine, 85% look at the company’s website, 80% read customer reviews, nearly 30% follow its social media account, and about 10% download content from the company’s website. [The Efficacy of Inbound vs. Outbound]
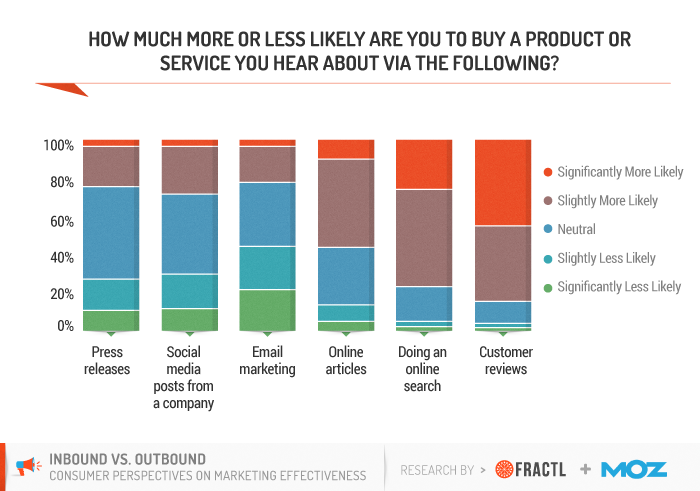
98. Over 75% of people are positively influenced by what they find via search engines. Over 50% are more likely to make a purchase if they read about it in an online article. Less than 50% are positively influenced by what they read in press releases or social media posts. Close to 45% are less likely to buy something featured in a marketing email. [The Efficacy of Inbound vs. Outbound]
99. 24% of survey respondents had clicked on a social media ad during the previous week, 18% had clicked on a sponsored story link, and 16% had clicked on a display ad. 54% of survey respondents had not clicked on any online advertising. [The Efficacy of Inbound vs. Outbound]
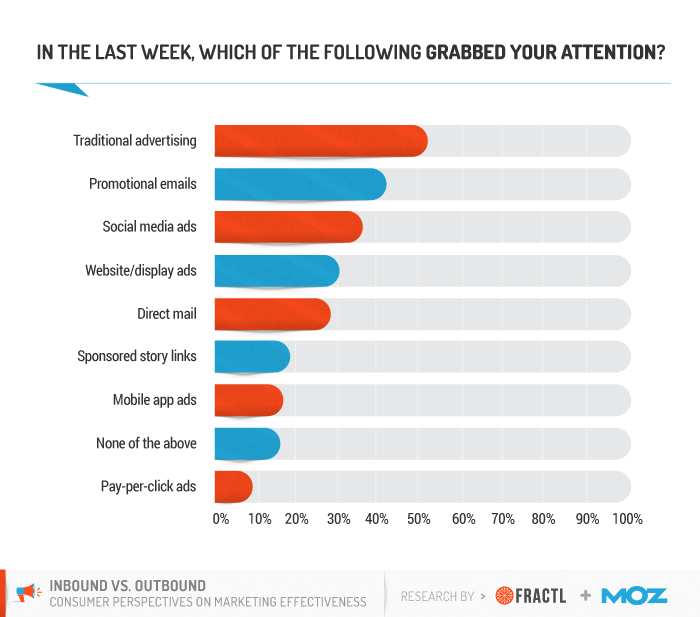
100. The top types of outbound marketing that respondents said grabbed their attention are traditional advertising (over 50%), promotional emails (41%), and social media ads (36%). [The Efficacy of Inbound vs. Outbound]
101. When asked, “What is an effective way for a company to attract your business?” the top answers were mailing offers for discounts or free trials (54%), providing free content about a topic of interest (53%), and appearing in relevant search results (48%). The bottom answers were advertising in mobile apps (7%), advertising on social networks (25%), and advertising on websites (26%). [The Efficacy of Inbound vs. Outbound]
BONUS:
Communication

102. Our survey of more than 1,200 people revealed over 40% more respondents aged 18 to 24 rewrite emails to sound more intelligent than those aged 55 to 64. [The Email Effect: What Your Emails Say About You]
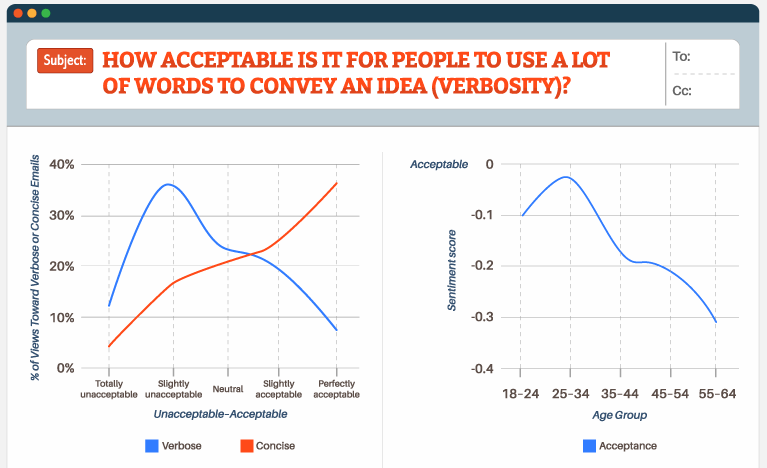
103. Close to 40% of all respondents said concise emails are completely acceptable, and around 35% said verbose emails are slightly unacceptable. 100% more respondents aged 55 to 64 prefer shorter emails than those aged 18 to 24. Over 30% of respondents aged 25 to 34 found longer emails acceptable. [The Email Effect: What Your Emails Say About You]
104. 61.7% said using humor throughout an email is acceptable. Breaking it down, 73.7% of those aged 55 to 64 agreed, and 16% more women were OK with funny emails than men. [The Email Effect: What Your Emails Say About You]
Use Content Marketing Statistics to Your Advantage
We didn’t conduct all of our content marketing research to brag about how good we are. Instead, we truly hope individuals and businesses are able to use our insights to benefit their brand.
For example, several of our stats show how positive content gets shared more frequently than negative content. There are certainly exceptions, but you’re best off creating content that leaves a smile on your readers’ faces.
Remember, we’ll be updating this post regularly with new content marketing stats. And if there’s something specific you’d like the stats on, let us know by commenting below or emailing me at [email protected].